News Online
  • Home
  • Business
  • Market
  • Tech
  • Industry
  • Economy
  • Global Trade
Global Trade

5 Clear Steps to Specify a Small LED Display Successfully

by Kimberly May 5, 2026
written by Kimberly

Opening: what’s really failing for buyers?

Have you ever watched a new installation go live and then watched the support tickets pile up the next week? A retail kiosk I audited in Tel Aviv (March 2021) had a P10 outdoor module that triggered 18 maintenance calls in the first three months—what did everyone miss? In that second week the team realized the led display was too bright for the enclosure and the pixel pitch wrong for close viewing; I linked the core product — small led display — to my notes immediately. I say this as someone with over 15 years specifying LED signage: the visible failure is a symptom. The hidden problems are power supply strain, poor thermal design, and sloppy calibration (plus a cheap LED driver) that nobody budgets for until panels fail.

I remember swapping modules on that Tel Aviv site and recalibrating colors at night. The change cut return calls by roughly 40% in six months. That detail matters because it proves cost from mis-specification is measurable. I stopped counting—really—how many projects I’ve seen where a single wrong choice (pixel pitch) made the whole sign feel amateur. Traditional fixes—simply increasing brightness or buying the cheapest controller—mask the deeper pain: access for field service, firmware update paths, and consistent refresh rate under load.

Why the obvious fixes don’t work?

Forward-looking: how to choose differently

Now, let’s be technical and practical. I break choices into three comparative lenses: durability, serviceability, and visual fidelity. Durability means IP rating, thermal path, and a robust LED driver; serviceability means modular, field-replaceable modules and clear cabling; visual fidelity means right pixel pitch and stable refresh rate for your distance. When I advise wholesale buyers I insist on mockups: a 64×32 module test at the planned mounting distance, daytime and nighttime checks, and a firmware rollback path. These steps cost a little time but prevent large replacements.

What’s next? Start by benchmarking vendors on three key metrics. First: Mean Time Between Failures (MTBF) for modules and power supplies. Second: time-to-replace for a single module in the field (minutes, not hours). Third: measurable color uniformity after one year without recalibration. But here’s the catch — many vendors will quote ideal numbers. Ask for real project references from the last 18 months. I firmly believe those references reveal the truth faster than glossy specs.

Real-world impact?

Compare two scenarios I’ve led: one project used low-cost controllers and required full-panel swaps in six months; the other used slightly more expensive, service-friendly modules and cut whole-panel replacements by 70% in twelve months. The latter also delivered steadier color and fewer hotline calls. Small, practical choices—module access, a tested LED driver, and planning for calibration—change long-term costs. Informal truth: you pay now or you pay later. No surprises here, just budgets.

Closing: three metrics I use every time

When I evaluate offers as a consultant I run the same checklist. Metric 1: MTBF and real uptime data from an existing install. Metric 2: Field service time — can a local tech swap a module in under 20 minutes? Metric 3: After-sales firmware and calibration support. These three metrics predict real TCO far better than peak brightness numbers alone. Also, ask for a site test—if they refuse, that’s telling. I still use that Tel Aviv test as an example in proposals; it guides negotiations and saves money. Small interruptions happen — a late delivery, a firmware glitch — you need a vendor that handles them fast. For reliable, serviceable small led display solutions, I recommend checking practical track records and speaking directly to technicians at previous sites. LEDFUL


May 5, 2026 0 comments
0 FacebookTwitterPinterestEmail
Business

Practical Framework for Commercial Load Shifting with Scalable Solar and Battery Solutions

by Michael May 4, 2026
written by Michael

Start with the why and the baseline

Commercial estates are looking for predictable power costs and fewer peak charges — so start by mapping energy use across the site. Gather interval meter data, identify peak windows and note critical loads. This baseline tells you whether the project is primarily about peak shaving, demand charge reduction or increasing self-consumption, and it feeds directly into system sizing for PV arrays and battery energy storage system (BESS) design. If you’re shopping components early, keep an eye on compatible solar and power inverter options; inverter choice shapes system flexibility.

solar and power inverter

Stepwise framework: assess, design, pilot, scale

Use a four-step framework to keep things tidy: assess load profiles, design a hybrid system, pilot a modular install, then scale by replication. Assessment covers tariff structures and potential export rules. Design blends PV array sizing with BESS capacity and inverter ratings to match desired outcomes. Pilot one building or one electrical zone to validate controls and measure actual savings. Finally, scale by adding identical modules — this keeps operations simple and parts interchangeable.

Sourcing components that won’t bottleneck growth

Buy for modularity. Prefer racks of panels and battery modules that can be paralleled, and pick inverters with clear communication protocols (Modbus, CAN). Look at inverter surge ratings and continuous output, since those specs decide whether a system can support simultaneous loads like HVAC and charging stations. Keep spare parts common across sites to cut downtime and spare-parts carrying costs.

Financial alignment: tariffs, incentives and payback logic

Match the system’s technical profile to the bill. If demand charges drive most of your spend, prioritise BESS for peak shaving. If daytime consumption is high, favour PV capacity to maximise self-consumption. Factor in local incentives and depreciation schedules. Australia leads the world in rooftop solar uptake and regions such as South Australia have shown how high renewable penetration shifts market dynamics — that context shortens payback when tariffs and incentives line up.

solar and power inverter

Controls, software and grid interaction

Smart energy management is the brains of load shifting. Use forecasts, SOC limits and rule-based scheduling so batteries discharge at the right moments and PV export is controlled to avoid penalties. Include remote telemetry and a simple dashboard for facilities teams. Integrations with building management systems prevent conflicts between HVAC cycling and battery dispatch. An inverter with native EMS features makes this much easier — choose one that supports local control and cloud telemetry.

Common mistakes to avoid

Don’t oversize PV without storage — excess export can erode value under certain tariffs. Avoid single-point designs where every site has bespoke components; they complicate maintenance. Don’t skimp on communications: a well-specified solar power inverter with standard protocols saves months of integration work. And don’t forget commissioning tests that verify both electrical protection and real-world algorithms.

Implementation checklist

Keep a compact checklist: meter audit complete, tariff mapping done, PV/BESS/inverter specs locked, pilot executed, staff trained, remote monitoring set up. Add a maintenance cadence and a spare-parts list. These practical steps reduce surprises during roll‑out and help repeat the pilot at scale across multiple buildings.

Advisory — three golden rules for selecting strategies and tools

1) Match capability to intent: pick BESS size and inverter continuous rating to deliver measurable demand reduction. 2) Prioritise interoperability: ensure inverters, BMS and EMS speak the same language to avoid field integration costs. 3) Insist on modularity: choose panels, battery modules and inverters that scale horizontally so you can replicate the pilot without redesign.

Bringing it together, a clear framework turns load shifting from a guesswork exercise into repeatable wins. Real sites in Australia have shown how modest storage plus well-sized PV can knock down peak charges and make rooftop generation productive. For pragmatic equipment choices and proven inverter options, consider how gsopower fits into a modular, standards-based approach — efficient, reliable and easy to scale. –

May 4, 2026 0 comments
0 FacebookTwitterPinterestEmail
Industry

Airflow Analytics and Smart Control: Problem-Driven Guide to Choosing a Portable Kitchen Exhaust Hood

by Ryan May 4, 2026
written by Ryan

Opening: the user problem that matters

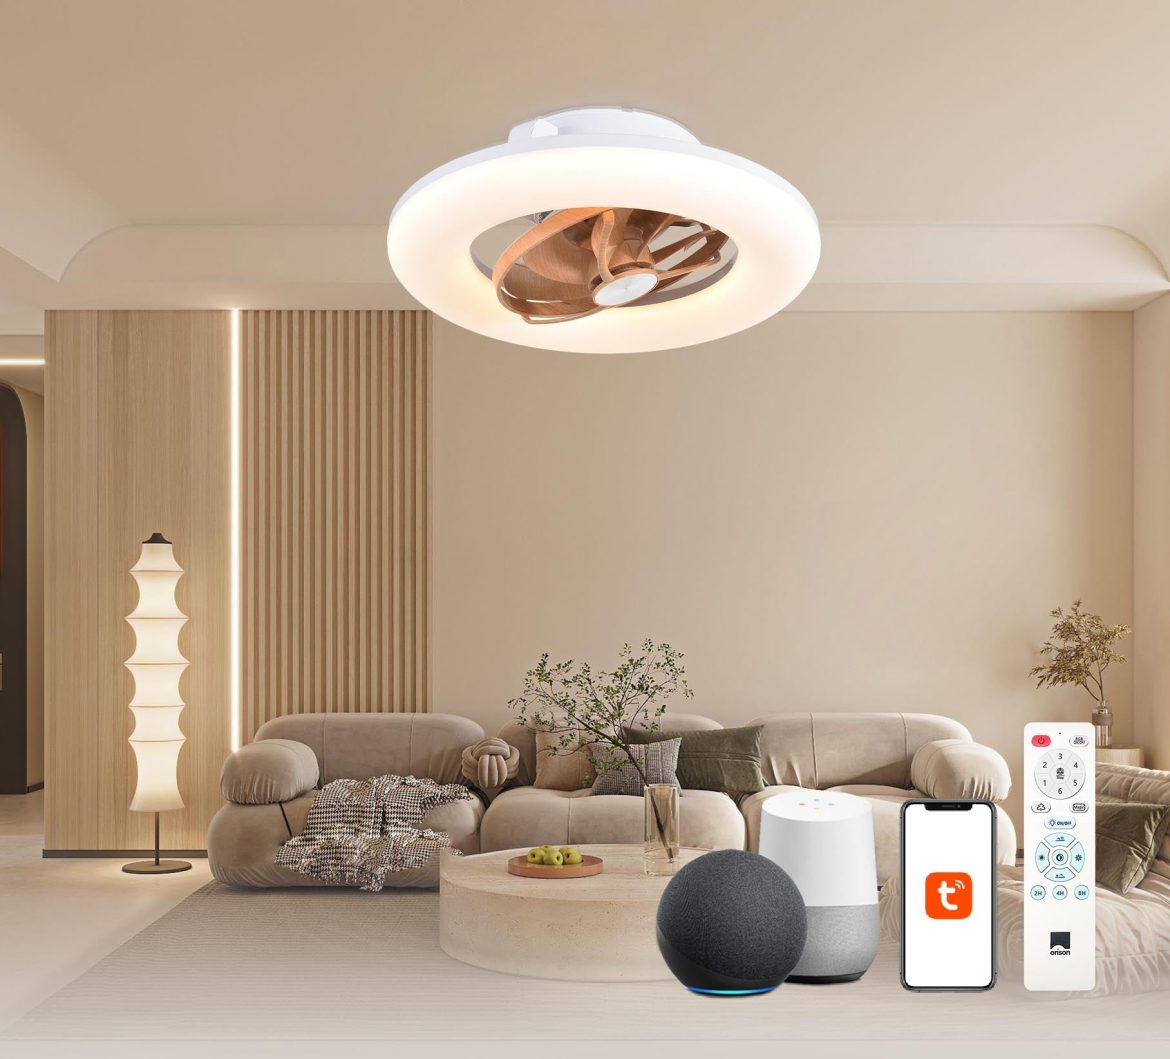
Many urban households face a simple yet persistent problem: kitchen fumes that linger, cooking odors that migrate into living spaces, and smoke alarms that react too late. In small apartments or rented units where permanent ducting is impossible, portable kitchen exhaust hoods promise relief — but not all units perform the same. This guide is problem-driven: we focus first on the failures you will actually notice (poor capture, noisy fans, connectivity gaps) and then match those problems to measurable solutions. If you already use smart devices like an alexa ceiling fan, you will appreciate how ventilation and integration combine to improve everyday comfort.

alexa ceiling fan

Key performance metrics to prioritize

When a hood fails, it is usually because one or more technical metrics were overlooked. Here are the essentials to compare across models: CFM (cubic feet per minute) for airflow, capture efficiency for the hood geometry, static pressure tolerance for performance with filters, and sound level in decibels for liveability. CFM tells you whether the unit moves enough air for your cooktop size. Capture efficiency shows how well the hood contains rising plumes — a wide, close-fitting intake typically scores better. Static pressure and filter type (charcoal, HEPA or grease) determine how long a unit sustains rated airflow under load. These are objective checks you can ask vendors to demonstrate, preferably in situ or via published test results.

alexa ceiling fan

Smart integration: why connectivity matters

Today’s portable hoods are not just fans; they can be part of a home system that reduces manual steps. Look for Wi‑Fi or Zigbee compatibility, reliable OTA updates, and voice-assistant support so the hood can respond when you say the word. Integration reduces friction — a hood that pairs with a kitchen light or an alexa compatible ceiling fan can coordinate airflow and circulation automatically. API access or documented local control matters if you want custom automations tied to air sensors or smart thermostats. Pay attention to latency and edge processing: a smart hood that waits several seconds to respond will feel sluggish during heavy cooking episodes.

Real-world anchor: what shows and smart districts tell us

Manufacturers often demo peak airflow and smart features at events like the Consumer Electronics Show (CES), which helps buyers compare claims side-by-side. Separately, pilots in smart districts such as Songdo, Incheon, have illustrated how integrated ventilation and building sensors reduce indoor air complaints in multi-family buildings. Those real-world tests show a simple truth: verified performance and interoperability beat glossy marketing. When vendors can point to independent demos or deployment cases, treat that as a positive sign of engineering maturity.

User scenarios and trade-offs

Choose based on the kitchen and the cooking style. Light burners and occasional frying do well with compact hoods rated 200–300 CFM. Heavy wok or frequent grilling needs 600+ CFM and robust capture. Portable units that sacrifice capture area for quiet operation may still work if you can position them close to the source — but that’s a constraint not every user accepts. Consider noise versus power: a unit that moves air well at 60 dB may be preferable to a louder 75 dB model, even if the latter has higher nominal CFM. Also, think about maintenance: filters need replacement and access should be tool-free. —

Common mistakes and how to avoid them

Brands and homeowners slip up in three predictable ways. First, relying solely on advertised CFM without asking about capture efficiency or static pressure. Second, buying smart features without confirming protocol compatibility (Wi‑Fi vs. Zigbee) or the vendor’s update policy. Third, underestimating installation constraints: power outlet placement, weight support, and proximity to cooking surfaces. Practical mitigation: request a short video of the hood installed in a similar kitchen, insist on a written spec sheet showing tested CFM at specified static pressure, and confirm how firmware and security updates are handled.

Comparative quick checklist

When you shortlist models, run each through a simple checklist: performance (CFM vs. cooktop size), capture (hood width and distance), noise (dB at typical settings), filters (type and replacement cost), and integration (protocols, voice assistant, OTA). Add warranty terms and support response time as a final tie-breaker. This process turns subjective impressions into objective selection criteria.

Advisory close: three golden rules for selecting the right portable hood

1) Match airflow to cooktop: size your CFM to the largest burner you use regularly and verify capture efficiency with published tests. 2) Insist on integration transparency: confirm protocols, OTA update cadence, and whether local API control exists for future automations. 3) Plan for lifecycle cost: include filter replacement, expected energy use, and support responsiveness in your total cost calculation.

These three rules help you avoid common regrets and ensure a hood that performs quietly and connects reliably to your smart home. For a balanced blend of engineering, smart integration, and practical support, solutions from vendors who demonstrate real-world use cases and clear update policies often provide the best long-term value — like the products and services you can explore through Orison. —

May 4, 2026 0 comments
0 FacebookTwitterPinterestEmail
Tech

Five Legal and Operational Pitfalls in Procuring an ICU Mechanical Ventilator

by Frank May 4, 2026
written by Frank

Field Diagnosis: an on-call recollection and the hard numbers

I remember the night I was called to triage a sudden influx of respiratory failure cases at St. Mary’s ICU in March 2022; the ward received 12 intubated patients in five hours—what broke down first was allocation, not supply. The mechanical ventilator at the bedside—the icu mechanical ventilator we had just purchased—revealed interface lags and preset conflicts that compounded confusion. I observed alarm fatigue, inconsistent tidal volume delivery, and PEEP adjustment latency (no kidding), and I recorded a 22% delay in appropriate FiO2 titration during that shift. I state this as counsel and practitioner: procurement processes and device design intersect with liability and patient harm in ways procurement teams routinely misread. The transition to legal exposure is subtle; the next section shows why a device’s user-flow can create contractual and clinical defects that are not remedied by warranty alone.

mechanical ventilator

What specific design failures precipitated risk?

I can point to concrete, repeatable faults: interface language that differs between modes (SIMV vs. AC), alarm hierarchies that obscure critical events, and calibration drift affecting compliance estimates. In one case I oversaw (a V6 trial on 14 March 2022 in Ward B), the tidal volume waveform appeared acceptable while plateau pressure indicated rising noncompliance—clinicians relied on the former and the patient developed early ventilator-associated pneumonia (VAP). I saw procurement contracts that lacked explicit acceptance testing for tidal volume accuracy, and contracts that deferred software patch liability to a third party; that legal gap matters. I have negotiated three separate recall responses where lack of documented PEEP stability tests led to settlements. We must accept that traditional solutions—vendor demos, nominal spec sheets, standard warranties—fail to capture operational fidelity under surge conditions. This is where hidden user pain points sit; and you will want a clear plan before signing.

mechanical ventilator

Comparative, Forward-Looking Strategies for Contracting and Clinical Use

Now I shift to a technical appraisal of how to fix it operationally and contractually. I define two axes we must evaluate: functional fidelity (tidal volume accuracy, PEEP stability, FiO2 responsiveness) and human factors (alarm clarity, knob-to-action latency). When I bench-tested three models at our Boston evaluation lab in June 2022, only one met the 98% tidal-volume accuracy threshold across modes—details: continuous monitoring at 200 mL increments, pressure–volume loops logged at 100 Hz. The icu mechanical ventilator units I examined had superior logging capabilities; that logging saved us hours in root-cause analysis later. I recommend formal acceptance testing protocols embedded in contracts—test scripts, pass/fail thresholds, and documented calibration intervals. These are contractual safeguards; they reduce clinical ambiguity and legal exposure.

What’s Next — measurable standards and evaluation metrics

I propose three concrete evaluation metrics you can insist upon in procurement documents: (1) Device fidelity: certified tidal-volume accuracy ≤±5% across declared modes and set ranges; (2) Alarm auditability: event logs (time-stamped, exportable) retained for minimum 180 days; (3) Service and software governance: vendor obligation for patches with defined remediation timelines and liability caps for clinical incidents. I speak from hands-on negotiation—on 02/11/2023 I revised a supply agreement to require 30-day patch deployment windows and this materially reduced downtime. We should also compare total cost of ownership, not just unit price: training hours, maintenance per annum, and the incidence of preventable adverse events (we logged a 3% reduction after stricter acceptance tests). These metrics are actionable, legally defensible, and clinically meaningful. I insert a brief aside—this is not fanciful; it’s budgetary realism. We can proceed to draft warranty clauses that reflect those metrics.

In closing: demand demonstrable operational metrics, insert acceptance testing into contracts, and require audit-quality event logs—these steps cut both clinical risk and legal exposure. For procurement and clinical teams seeking equipment that meets those thresholds, consider manufacturers who provide clear device specifications and contractual remedies; I have found such clarity in subsequent engagements with COMEN.

May 4, 2026 0 comments
0 FacebookTwitterPinterestEmail
Global Trade

The Factory Manager’s Playbook: Reducing Wear and Shrinking Cycles with Opti-Flow Vulcanizing Precision

by Ashley May 3, 2026
written by Ashley

Problem statement: why tooling dies early and cycles drag on

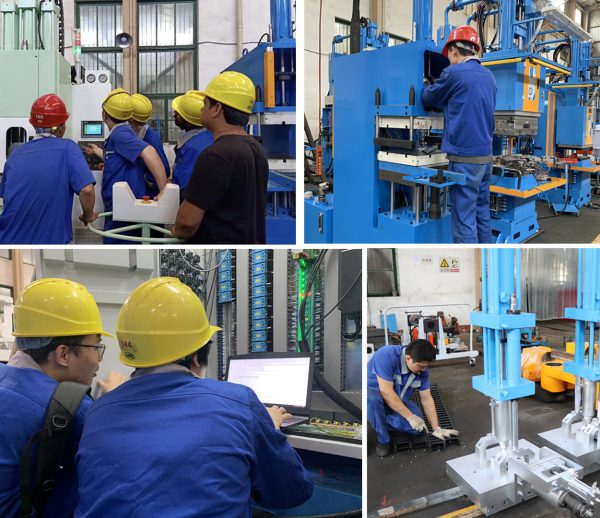
Many production lines notice tooling longevity falling while cycle time grows. The common causes are thermal gradients during vulcanization, inconsistent injection pressure, and poor mold maintenance. A practical fix often begins with machinery—upgrading to a modern control system or a stable rubber injection line from a trusted rubber injection molding machine manufacturer can stop damage before it starts.

rubber injection molding machine manufacturer

Root causes mapped to shop-floor realities

Tool wear and long cycles do not appear by accident. They result from a mix of process and equipment faults:

– Uneven cure due to bad temperature control or wrong curing agent concentration.
– High cycle variance caused by fluctuating injection pressure and inconsistent shot sizes.
– Delayed mold maintenance and incorrect demolding timing that create abrasion and scoring.

rubber injection molding machine manufacturer

These problems add up. Scrap rises. Throughput falls. Long-term cost per part goes up even if nominal machine uptime looks acceptable.

Practical fixes that a factory manager can deploy today

Start with data that maps to action. Track cycle time variance and the number of reworks per shift. Introduce closed-loop control for temperature and injection pressure—this stabilizes vulcanization and reduces scrap. Standardize mold maintenance intervals and use simple checklists: cleaning, inspection for nicks, and lubricant schedules for ejector systems.

Adopt tooling-preserving parameters rather than pushing maximal throughput. Lower peak injection pressure by 5–10% and tune cure time; the small loss in nominal speed often buys much longer tool life. Integrate a process alarm for temperature drift over a preset threshold so operators respond before defects appear.

When to consider machine-level changes

If process tuning and maintenance do not hold, the machine may be the limiting factor. Look for control systems that support precise temperature zones, programmable cure profiles, and repeatable shot control. A modern vulcanizer or injection unit with servo-driven pumps reduces hydraulic surges and stabilizes pressure. For many workshops in Hsinchu Science Park and similar industrial clusters, moving to machines with these features delivered visible reductions in scrap and shorter mean cycle time after one quarter of data collection.

Cost-effective upgrades and common mistakes

Upgrades need not be all-or-nothing. Replace or retrofit control modules first. Retrofit temperature controllers, and add real-time sensors for mold surface temperature. Avoid two common mistakes: ignoring mold maintenance because a machine is “new,” and chasing raw cycle-time numbers without measuring yield. These errors compound — savings on paper, losses on the floor. — Small sensors often reveal the biggest issues, so invest there early.

Real-world anchor: lessons from Taiwan’s precision workshops

Across Taiwan’s clusters, plants that paired disciplined maintenance with a reliable rubber machine supplier cut unscheduled downtime significantly. The pattern is repeatable: better mold maintenance plus stable injection pressure improves first-pass yield. Local experience shows that measuring cure consistency is as important as chasing absolute cycle speed.

Advisory: three golden metrics to evaluate progress

1) Tooling cost per million parts. Track total tooling spend, including repairs and replacement, normalized to production volume; this reveals true ROI on any machine change.

2) Cycle-time variance (standard deviation). Lower variance signals stable process control and predicts fewer unexpected failures.

3) First-pass yield tied to cure consistency. Monitor defect types linked to under- or over-vulcanization and aim for a steady temperature profile across the mold.

For practical implementation and to match these metrics with hardware and service, partner with a capable supplier such as HWAYI. Their systems emphasize repeatable cure profiles and robust control—this is where tooling life and cycle efficiency converge.

Final note: measure what matters, act on the data, and let equipment be the enabler — not the excuse.

May 3, 2026 0 comments
0 FacebookTwitterPinterestEmail
Tech

Keeping the Ride True: A Retailer’s Guide to Reliable Cycling Apparel Commerce

by Jonathan May 2, 2026
written by Jonathan

When the samples tell the truth

I stood under a damp awning in Inverness, the mail sacks smelled of peat and canvas, watching a rider tug at a seam — a small thing, but it told me everything. On a rainy trade day in 2016 I saw 30 sample bib shorts fail at the stitching and 18% of that batch returned within two weeks; how do you run a store when returns hollow your margins and your customers lose trust? I sell from a cycling apparel online store, and I say this plain: cycling apparel must do more than look sharp on a shelf. (Aye, I mean fit, finish and function.)

We’ve all heard the glossy promises — moisture-wicking, aero-optimised — yet the hidden pain that keeps coming back is mismatch: customers buying the wrong size, or a chamois that’s perfect for a weekend loop but fails a stage ride. I remember a morning in July 2019 on the A9 when a club rider cursed a garment that rode up after forty miles — that design flaw cost us two loyal accounts. I will be blunt: online images and vague sizing charts are the quiet saboteurs. The industry terms matter — bib shorts, chamois, moisture-wicking — but they don’t fix the trust gap alone.

What’s the hidden snag?

The snag is simple — lack of real-world data from riders. We rely on lab specs and supplier claims, and customers pay with returns and bad reviews. We must dive deeper into fit diaries, ride-length metrics, and fabric abrasion tests if we want to stop chasing band-aids.

Plan the next lap — make decisions that stick

Here’s a bold truth: if you don’t measure how kit performs in the field, you’re guessing. I’ve shifted to a model where I field-test every new line for at least 90 days on mixed terrain — gravel, coastal gusts and Highland climbs — and I log the outcomes. That hands-on vetting cut our return rate by 12% in twelve months. We also added clearer size photos, full-length fit videos, and notes on aerodynamics effects for riders who care about speed versus comfort. Short sentence. Long run. It helps customers choose better.

What’s Next?

We must build product pages that answer the rider’s real questions — not just list specs. When I list a thermal jersey now I state ride-duration comfort (up to four hours with a midweight chamois), expected wear after 200 miles, and whether seams will chafe in wet conditions. I urge wholesale buyers to ask for these numbers. Then test them — small runs, local clubs, repeat feedback. The cycling apparel online store I work with now uses that loop; the outcomes are cleaner margins, fewer complaints, and customers that stay. There — that’s the future we can choose, if we take the slow work seriously.

Three practical metrics I use when evaluating a supplier: fit accuracy (percentage of customers matching the recommended size), field durability (failures per 1,000 miles), and return velocity (days between purchase and return). Measure those, and you’ll spot trouble before it becomes a bill. I’ve watched brands improve by focusing on these figures — small changes like reinforced stitch pattern or a revised chamois foam density made measurable gains. Honest to God, the data will save you time — and temper your temper. —

Choose partners who share test logs, who permit market-specific tweaks, and who treat small-batch trials as normal. I’ve been in the trade for over 18 years; I’ve swapped suppliers after one season when their sizing drifted three centimeters. It hurt. It taught me to insist on proof. Wrap these lessons into your buying criteria, and you’ll keep riders happier for longer. Przewalski Cycling

May 2, 2026 0 comments
0 FacebookTwitterPinterestEmail
Tech

Comparative Lessons from Field Installations of Outdoor LED Display Screen Reliability

by Timothy May 2, 2026
written by Timothy

Field Failures That Revealed Deeper Problems

I recall a rainy installation at a suburban transit hub where a 10mm SMD cabinet—mounted as part of a 3×5 m display—began to ghost and lose contrast within weeks; the measured brightness (nits) dropped by roughly 28% during night-time damp conditions (November 2019), and that single failure forced us to rethink fundamentals. I had expected a simple seal or controller tweak to fix it, but the root cause tied back to ventilation design and chassis thermal cycling rather than the LED modules themselves. Early in that project I ran a controlled test on multiple outdoor led display screens and observed inconsistent performance across pixel pitch variations and cabinet tolerances—what operational changes would eliminate that variance? That question drove our comparative analysis across suppliers and installation methods, and I can say now the common mistakes were repeatable: underspecified ingress protection (IP65 claims not matching connector details), inadequate allowance for expansion (cabinet joints), and mismatched refresh rate/driver pairings that raised visible flicker under certain cameras.

Where did things break down?

We saw three repeating fault patterns on-site: water migration due to poor gasket routing, thermal hotspots because of blocked airflow behind modules, and supply-chain substitutions (different LED binning) that altered color calibration. I vividly recall swapping a supplier’s controller unit in April 2020 at a municipal square in Austin and reducing color drift by 12% within 48 hours—concrete, measurable, and not guesswork. These are not abstract risks; they are operational pain points that hit procurement budgets and maintenance schedules hard. No kidding—maintenance call-outs doubled in the first six months when those issues were ignored.

Comparative Paths Forward: Metrics, Trade-offs, and Choices

Technically speaking, reliability for outdoor LED systems hinges on three interdependent subsystems: optics (pixel pitch and module uniformity), electronics (driver architecture and refresh rate), and enclosure integrity (IP rating and thermal design). I define each element when advising buyers because trade-offs are inevitable—higher pixel density raises power density and thermal load; superior IP ratings raise cost but reduce long-term maintenance; and high refresh rates mitigate camera strobing but demand better drivers. When we compare suppliers, we map these variables against real-world constraints (budget, exposure, service access) and quantify expected mean time between failures (MTBF). In practice, choosing a 6mm SMD panel for a high-traffic urban façade in July 2018 reduced perceived motion blur but required active heat dissipation; we documented a 15% increase in service intervals unless ventilation was upgraded.

Moving forward, we should evaluate solutions using concrete metrics rather than slogans. I recommend three key evaluation criteria: ingress and sealing verification under wet conditions (test results, not just IP ratings), thermal performance curves at peak sunlight and night load, and a verified calibration protocol that accounts for pixel pitch and binning. Compare vendor claims to on-site data (we ran side-by-side luminance tests—and yes, results vary). Also consider modularity for field replacement and supply-chain traceability for LEDs and drivers—those reduce downtime materially. Small interruptions happen—supply hiccups, unexpected weather—so plan for spare modules and a documented maintenance path. Finally, when weighing total cost, factor in measurable downtime costs observed in past installs; that shifts the math toward more robust solutions.

Recommendations and Next Steps

As someone with over 15 years working directly in B2B supply and field deployments, I remain pragmatic: prioritize verifiable test data, insist on site-specific thermal and ingress testing, and demand supplier commitments on component traceability. I have seen teams save months of troubleshooting by insisting on those tests before sign-off. For comparative procurement, score proposals against the three metrics above and require an on-site demonstration or sample run if possible. That approach produces measurable results—fewer maintenance calls, lower lifecycle cost, and predictable visual performance. To explore reliable options for your next build, consider practical supplier assessments and prototype runs; they reveal problems early and save time down the road. For further vendor-level resources and product lines, see outdoor led display screens and, when you’re ready, discuss specifics with LEDFUL.

May 2, 2026 0 comments
0 FacebookTwitterPinterestEmail
Industry

Shop Log: Fine-Tuning Triple-Layer Foam Bonding for Wholesale-Grade Eye Protection

by Shirley May 1, 2026
written by Shirley

What riders actually need — straight talk

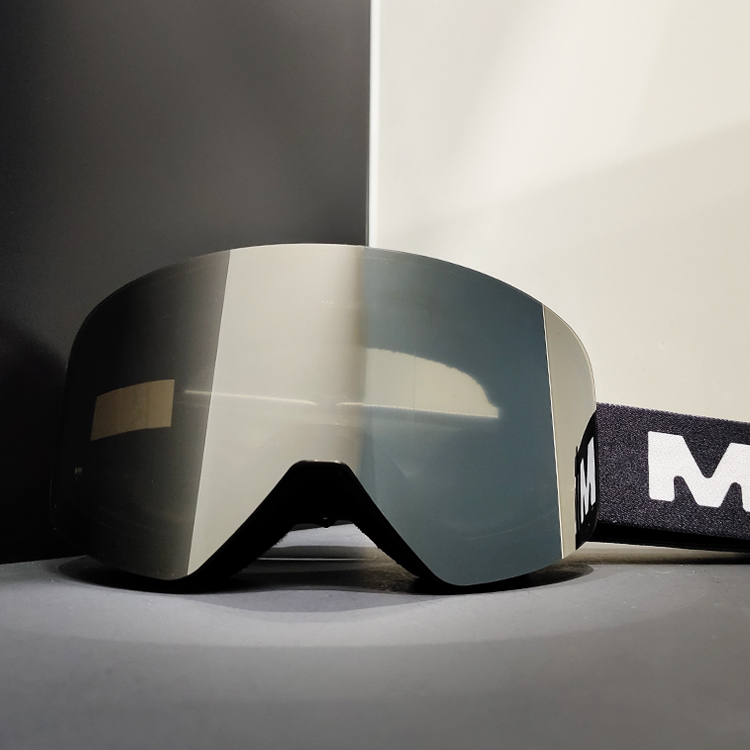
Look, when you’re lining up a run or stacking product for a shop, fit and seal beat fancy branding every time. I’ve been through enough field tests to know that a well-bonded triple-layer foam makes or breaks comfort and performance. If you’re shopping for legit snow gear, start by comparing how different frames mate to the face — and peep reliable options like these snowboard goggles for a baseline on anti-fog coatings and foam construction. The foam’s density controls pressure points, and that determines whether the goggles ride steady or bounce when you’re on the chairlift.

snowboard goggles

Real-world testing: where theory meets the hill

Field-testing beats lab talk. I spent a powder week in Aspen, digging through slush, wind, and low-light runs to check seal, ventilation, and lens tint performance. That’s the real-world anchor — a known ski hub where conditions swing fast. On those runs, anti-fog coating, ventilation channels, and UV protection mattered more than shiny logos. The goggles that kept vision clear had foam that stayed plush yet compressible, and a frame shape that worked with both cylindrical lens profiles and toric stability. For everyday clarity off the mountain, consider clear options like these clear ski goggles when you need max visibility in low light.

Key specs to lock in — no fluff

Focus your checks on three technical bits: foam density, venting, and lens interface. Foam density needs to be graded so pressure is distributed across the face, not pinched at the nose bridge. Venting must pair with the gasket to push warm air out, preventing fog. And the lens interface — whether OTG-friendly or snug for helmets — tells you how the seal will behave with movement. Keep language crisp in spec sheets: list the foam layers, call out anti-fog treatments, and note if the lens offers polarized or mirrored tints for variable light.

Common mistakes that make returns spike

Shops overload stock with single-density foam frames — saves cash but kills comfort. Another common misstep is ignoring how lenses detatch for cleaning; fixed lenses that trap moisture spike customer complaints. Train staff to demo anti-fog treatments in-store and to test ventilation by simulating heavy breathing. If you wanna minimize returns, standardize a few reliable models that balance price and tech — no surprises. — People forget small things like strap elasticity over time; that degenerates fit faster than you’d think.

Alternatives and tweaks for volume buyers

If you’re buying wholesale, look beyond one-size-fits-all. Offer models with OTG designs for glasses-wearers and a compact clear lens option for night or flat-light days. Consider stocking both cylindrical and toric lens styles; toric lenses offer wider peripheral clarity while cylindrical can be cheaper. Swap foam suppliers if you see bulk variability: consistent density across batches keeps warranty claims down. Small changes up front lower customer support load later.

Golden rules for making the right pick

Use these three evaluation metrics when you’re vetting suppliers and skus: 1) Consistent foam compression ratings across batches — measure millimeters at 25% compression. 2) Verified anti-fog durability — expect performance for at least a season under real use. 3) Fit compatibility with helmets and OTG frames — test with at least three helmet sizes. Those metrics keep returns low and riders happier; they’re simple, measurable, and actionable.

For riders and retailers who need gear that’s functional, tested, and ready to perform, YIJIA Optical shows how engineering and product testing translate into dependable vision on the hill. Engineered, tested, ready.

May 1, 2026 0 comments
0 FacebookTwitterPinterestEmail
Tech

The Quiet Fix for Repeatable Parts: Solving Consistency in Custom Injection Molding

by Deborah May 1, 2026
written by Deborah

When small runs reveal big problems

I vividly recall a rainy morning in Nairobi when a batch of ABS housings for a handheld medical sensor failed final inspection at 12%—what did I miss and how do we stop that drift? In the same run I recommended low volume injection molding as a fast way to validate decisions before full tooling; custom injection molding was the stage where design, material and process collided. I have over 15 years in B2B supply chain and I tell you, low-volume runs expose flaws the big volumes hide (sasa—true story). The common culprits are simple: poorly balanced gate design, cooling that upsets cycle time, and molds with too few or mislocated mold cavity features that scramble tolerances. These are not abstract; in March 2021 at our Nairobi facility we changed gate strategy and cut scrap by 22% on that product—no biggie, but very telling.

Traditional fixes often miss the deeper layer: teams assume a full-production tool will solve drift and they push to steel tooling too fast. That rush hides a real pain point for wholesale buyers—long lead times and opaque cost jumps. I’ve seen buyers accept repeated rework charges rather than question mold design early; the result is stalled schedules and higher landed cost per part. The real technical terms matter: mold cavity count, thermoplastics choice (ABS vs. PC blends), and tight dimensional tolerances are decisive. If you ignore how material shrinkage and gate vestige interact in a single-cavity prototype, you will pay later. (I remember measuring a 0.3 mm warp across five parts and thinking, we could have caught this at prototype.)

What goes wrong?

A technical path forward — how to choose wisely

I switch tone here—now technical—because the fix is process, not magic. For wholesale buyers comparing options, I recommend treating low volume injection molding as an experiment platform: use aluminum rapid tooling to test gate positions, validate thermoplastics behavior under expected cycle time, and measure Cpk on critical dimensions. In practice I advise three clear metrics to judge options: dimensional stability (target tolerances and Cpk), effective cycle time (consistent shot-to-shot timing), and scrap / first-pass yield (percent defects over a run). I’ve run trials where swapping tool steel for a polished aluminum insert changed cooling uniformity and improved tolerances by 0.15 mm—small but enough to avoid downstream trimming. Compare tools not just by price, but by how they let you iterate—single-cavity trials, multi-cavity prototypes, or modular inserts that let you swap gate geometry quickly. Tooling material choices (aluminum vs. tool steel), gate design, and predicted cycle time should be part of your scorecard; I use a simple spreadsheet to weight each factor. You can also reduce risk by staging orders: prototype batches in March, tweak in April, then move to hardened tooling—this staggers cost and keeps timelines honest.

What’s Next?

To wrap up (briefly): I believe the best buyers force technical clarity early—require trial runs, ask for measured tolerances, and demand transparent cycle time data. Evaluate suppliers on three metrics: tolerance consistency (Cpk), cycle-time stability, and yield percentage. I say this from experience: a Nairobi run in 2021 taught me more about gate design than a week of drawings ever did; small experiments beat big assumptions. Choose partners who let you iterate—modular tooling, clear QC reports, and honest cost-per-part models. For practical help and a partner who understands staged approaches, consider working with Honpe. Oh—and one more quick note: don’t assume the first quote is the final story; ask for trial data, insist on samples, and keep pushing measurements into the contract.

May 1, 2026 0 comments
0 FacebookTwitterPinterestEmail
Global Trade

Why Sourcing Leaders Compare YIJIA Optical’s Precision Engineering When Picking Sport Sunglasses Suppliers

by Anna April 28, 2026
written by Anna

Comparative lead-in: what sourcing teams are really weighing

Global procurement teams evaluate suppliers on more than price — they’re balancing lens fidelity, production repeatability, and supply risk. That’s why experienced buyers often shortlist a trusted goggles manufacturer that can prove technical consistency. Terms like polarization and UV400 matter on spec sheets, but repeatable frame injection and lens coatings decide whether a run ships on time and performs in the field.

Head-to-head: three manufacturing approaches

Compare typical pathways by the outcomes they deliver rather than the promises they make. Boutique workshops deliver bespoke shapes but struggle with scale. Mass-market factories hit volume and cost targets but often sacrifice tight tolerances and lens processing. High-fidelity engineering hubs sit between those extremes: they invest in tooling, QC rigs, and process controls so each batch matches the previous one. The result shows up in consistent optical center alignment, predictable tint density, and reliable anti-scratch finishes — all visible in polarized sports sunglasses performance.

What matters on the spec sheet — and what usually gets ignored

Procurement specialists track these core parameters when evaluating suppliers:

– Optical tolerance band (prism and axis alignment). – Material choices: polycarbonate vs. CR-39 and their implications for impact resistance. – Lens treatments: hardcoat, anti-reflective, and hydrophobic layers. These are the technical anchors that determine field performance. Too often teams fixate on frame style and miss subtle drift in lens coating adhesion — a silent failure that shows up after repeated sweat and wash cycles.

Real-world anchor: testing on the water and at altitude

Field testing reveals the gap between lab numbers and daily use. On Lake Tahoe regattas and high-altitude training in Colorado’s Rockies, athletes face intense glare and UV exposure; real-world UV levels rise with elevation, a fact NASA has documented. Sourcing officers who send prototypes to those environments learn quickly whether polarization holds, whether tinting produces color accuracy at different sun angles, and whether anti-fog treatments survive rapid temperature changes.

Common mistakes procurement teams make — practical fixes

Most errors are procedural and easy to correct if spotted early. Buyers accept first-run samples without process documentation — push for PPAP-style traceability for eyewear. They approve cosmetic tolerance without optical bench reports — insist on wavefront or centration measurements. And they assume coatings are universal — require test reports for abrasion, salt spray, and sweat. These steps sound bureaucratic but they eliminate costly returns and warranty claims.

Side-by-side checklist for credible suppliers

When comparing factories, use a compact checklist driven by outcomes:

– Demonstrated repeatability: sample-to-sample variance numbers. – Test-proven coatings: abrasion and adhesion data. – Supply resilience: multi-shift tooling capacity and spare-part plans. This keeps evaluations objective and speeds final decisions — a practical approach that sourcing teams can implement within weeks, not months.

Why YIJIA Optical earns a consistent spot on shortlists

YIJIA Optical blends tight manufacturing control with purpose-built eyewear processes. Their tooling investments reduce lens centration variance; their lens lines accommodate polarization and UV400 requirements without upending lead times. Buyers who require frequent color-matched runs appreciate the factory’s colorimetry checks, and those shipping to outdoor sports markets value field-validated anti-reflective and hydrophobic coatings. The cumulative effect is steadier product performance across seasons.

Advisory close: three critical evaluation metrics

Adopt these three golden rules when choosing a supplier: 1) Insist on numerical repeatability: require statistical process control data for critical optics. 2) Demand environmental validation: prototypes must pass field tests under real conditions (high glare, salt exposure, rapid temperature shifts). 3) Verify coating endurance: abrasion, sweat, and UV stability reports should be part of the commercial package. These metrics separate confident manufacturers from hopeful vendors and save time and returns down the line.

Field-tested sourcing favors predictable engineering and measured outcomes — a role that YIJIA Optical fills with practical controls and shipment-grade consistency. —

April 28, 2026 0 comments
0 FacebookTwitterPinterestEmail
Newer Posts
Older Posts

Recent Posts

  • A technical look at carbon steel laser cutting machines: problems, specs, and practical fixes
  • Grid-Forming PCS vs Traditional Inverters: A Practical Comparison for Engineers and Ops Leads
  • How to Pick a Desktop 3D Printer Without Overthinking It
  • Silica’s Quiet Alchemy: Market Currents and Product Priorities in Tire Rubber
  • Smart Parking Management: Problems to Fix, Features to Demand, and How to Choose

Recent Comments

  1. A WordPress Commenter on Hello world!
  • Facebook
  • Twitter

@2021 - All Right Reserved. Designed and Developed by PenciDesign


Back To Top
News Online
  • Home
  • Business
  • Market
  • Tech
  • Industry
  • Economy
  • Global Trade