News Online
  • Home
  • Business
  • Market
  • Tech
  • Industry
  • Economy
  • Global Trade
Global Trade

Material & Co-Extrusion Showdown: Comparative Insight into White Poly Mailers’ Performance Under Stress

by Laura April 16, 2026
written by Laura

Why a comparative lens matters for packaging choices

When your e‑commerce parcels end up on motorbike queues in Ho Chi Minh City or long conveyor lines at a regional hub, the envelope you choose speaks for your brand and protects the SKU — simple as that. A comparative view helps brands weigh trade-offs between cost, durability, and branding options. For example, if you’re choosing between branded sleeves and standard colored poly mailers​, you’re not just choosing aesthetics; you’re choosing barrier performance, seal integrity, and how the pack will behave under compression and abrasion.

Key performance metrics to compare

There are a few hard metrics that separate good poly mailers from risky ones: tensile strength, tear resistance, puncture resistance, and seal strength. Gauge — the film thickness — matters, but so does film structure. A monolayer polyethylene film can meet basic tensile specs, while a co‑extrusion structure with multiple layers often delivers better puncture resistance and moisture barrier without dramatically increasing weight. These are the numbers procurement teams should ask for during vendor comparison.

Lab tests vs. street tests: what each reveals

Lab tests (ASTM tensile, Elmendorf tear, ASTM puncture) give consistent, repeatable data on material properties. Field tests — sending sample consignments through actual fulfillment routes — reveal real failure modes: zipper creep, flap delamination, or abrasions from sorting belts. Both matter. Start with lab validation then validate with a small pilot run on your busiest route — you’ll see issues that lab conditions can’t replicate.

Co‑extrusion vs. single‑layer films: practical trade-offs

Co‑extrusion lets manufacturers combine a tough external layer, a stiff core, and a soft inner slip layer, which improves sealability and tear propagation control. Single‑layer films are simpler and sometimes cheaper, but they often trade off long‑term puncture resistance and consistent seal integrity. For high‑value items or long transit chains, co‑extruded films usually reduce package failures and returns — even if the per‑unit cost is slightly higher.

Branding, color, and customization decisions

Colour and print affect more than looks. Pigments and inks can alter film flexibility and heat‑seal characteristics; heavy print zones may create micro‑stress points under compression. If you need specific visuals, consider custom color poly mailers with tested ink formulations and approved heat‑seal windows. Those solutions let you keep brand impact while maintaining required sealing and tear performance — useful when merchants want a memorable unboxing without compromising logistics.

Common mistakes teams make — and quick fixes

Teams often focus solely on unit price and forget total landed cost: returns, reworks, and customer dissatisfaction add up. Another mistake is assuming all “12‑micron” or “2‑mil” films behave the same — production process and co‑extrusion profile change performance. Finally, skip the temptation to reduce adhesive on peel‑and‑seal too quickly; weaker adhesives lower seal strength. The remedy is simple: insist on sample seals tested at your target sealing temperature and run them through your conveyor and mailbox setups — you’ll catch issues early. —

How to structure vendor comparisons

Make a side‑by‑side matrix that includes: material construction (co‑extruded vs monolayer), gauge, tensile/tear/puncture numbers, seal strength at your sealing temperature, print compatibility, MOQ, and lead time. Add a field‑test column for pilot runs on representative routes. This comparative insight helps you separate suppliers who post good specs from those who deliver consistent, real‑world performance.

Real‑world anchor: lessons from recent e‑commerce surges

After the 2020 COVID‑19 surge in online shopping, many brands discovered that higher parcel volumes amplified small weaknesses in packaging, causing spikes in returns and customer complaints. In Southeast Asian markets like Ho Chi Minh City, rapid handling and mixed transport modes revealed the limits of thin monolayer films; suppliers who had shifted to engineered co‑extrusion films saw fewer failures and lower replacement rates. That practical lesson remains relevant for any brand scaling fast today.

Comparative summary

In short, the best white poly mailer for your operation depends on expected transit stress, product value, and desired branding. Co‑extruded, multi‑layer films generally win on puncture resistance and consistent seal integrity, while single‑layer films can be cost‑effective for low‑risk, local shipments. Testing across both lab and field conditions closes the gap between supplier promises and delivery.

Three golden rules for choosing poly mailers

1) Measure what matters: require tensile, tear, puncture, and seal‑strength data at your actual seal temperature and include a field‑test column. 2) Prioritize total cost of ownership: count returns, rework, and customer impact, not just unit price. 3) Insist on validated customization: if color or print is important, pick suppliers who provide tested ink and heat‑seal compatibility.

These rules point you to partners who can scale reliability and brand presence together — and if you want a pragmatic provider that balances engineered film performance and customization, consider how WH Packing integrates co‑extrusion know‑how with tested printing options. —

April 16, 2026 0 comments
0 FacebookTwitterPinterestEmail
Global Trade

Dual-Antenna Heading and Pitch Determination: Practical Comparisons for Getting Real Attitude Accuracy

by Kevin April 15, 2026
written by Kevin

Comparative snapshot: what matters out here

I size up attitude sensors the same way I size up farm kit — by how steady they run when the ground gets rough. A dual-antenna layout often beats a lone antenna for true heading and pitch, especially when paired with an rtk receiver or a portable bluetooth gnss receiver. The comparison’s simple: dual antennas give you a fixed antenna baseline to compute heading directly, while single-antenna systems lean on motion, magnetometers, or fusion with an IMU to estimate direction. For folks who need repeatable numbers — think row guidance or crane safety — the choice changes how you work each day.

How heading and pitch get measured

Dual-antenna rigs use the known separation between antennas to calculate heading from phase differences in GNSS signals. That antenna baseline is a straightforward geometric measure: longer baseline, better raw heading resolution. Pitch is derived from the relative vertical offset and signal geometry, sometimes augmented by an IMU. Single-antenna systems instead rely on movement or magnetic heading and then fuse that data with GNSS. Both approaches use RTK corrections to tighten horizontal and vertical estimates; RTK gives that centimeter-level control that makes heading meaningful rather than noisy.

Where the real-world test separates contenders

I’ve watched both approaches at work in an Iowa cornfield during planting season — tractors, narrow rows, a lot of signal bounce. Dual-antenna setups held steady when turns and lift happened. Single-antenna systems needed more motion before their heading settled. In construction, where machines tilt and jostle, the dual layout showed faster convergence and fewer unexpected offsets. That matters when tolerances are tight and rework costs money.

Trade-offs and common mistakes — learnin’ the hard way

Dual antennas add weight, a bit more cabling, and a cost premium. They also need careful mounting so the baseline stays stable. Folks often underestimate multipath around sheds and trees; no amount of fancy fusion fixes poorly placed antennas. Single-antenna units can be cheaper and lighter and work fine for slow-moving tasks, but they suffer during long idle periods or high roll/pitch scenarios — heading drifts until motion returns. Don’t forget alignment errors at installation — a few degrees off at mount time means bad data later. And yes — check your antenna phase centers. They matter.

Alternatives and practical combinations

For many jobs a hybrid approach wins: a dual-antenna system for primary heading and pitch, with an IMU and occasional RTK fixes to cover outages. Bluetooth GNSS receivers make pairing easier for mobile devices and offer low friction for field technicians, while a rugged RTK receiver delivers consistent corrections for permanent mounts. Consider software that supports seamless switching between sensors so you get continuous attitude estimates even if one input degrades.

Golden rules for selecting attitude sensors

1) Evaluate true baseline needs: pick a dual-antenna spacing that produces the heading resolution your task requires. Short baselines save space but cost precision. 2) Test under realistic site conditions: try your setup near buildings, trees, and reflective surfaces before you buy. Real-world anchors like farm trials in Iowa or known construction benchmarks reveal faults fast. 3) Match corrections and comms: ensure your RTK source and any bluetooth links stay reliable for the job length; intermittent corrections give jittery outputs.

These rules steer you right and cut down on surprises — Archimedes Innovation builds solutions that fit those practical checks, keeping systems robust in the field. —

April 15, 2026 0 comments
0 FacebookTwitterPinterestEmail
Business

Resolving Exterior Glare Bottlenecks: Practical Troubleshooting for Light Trespass and Visual Artifacts

by Linda April 15, 2026
written by Linda

Opening the problem — why controlled illumination matters

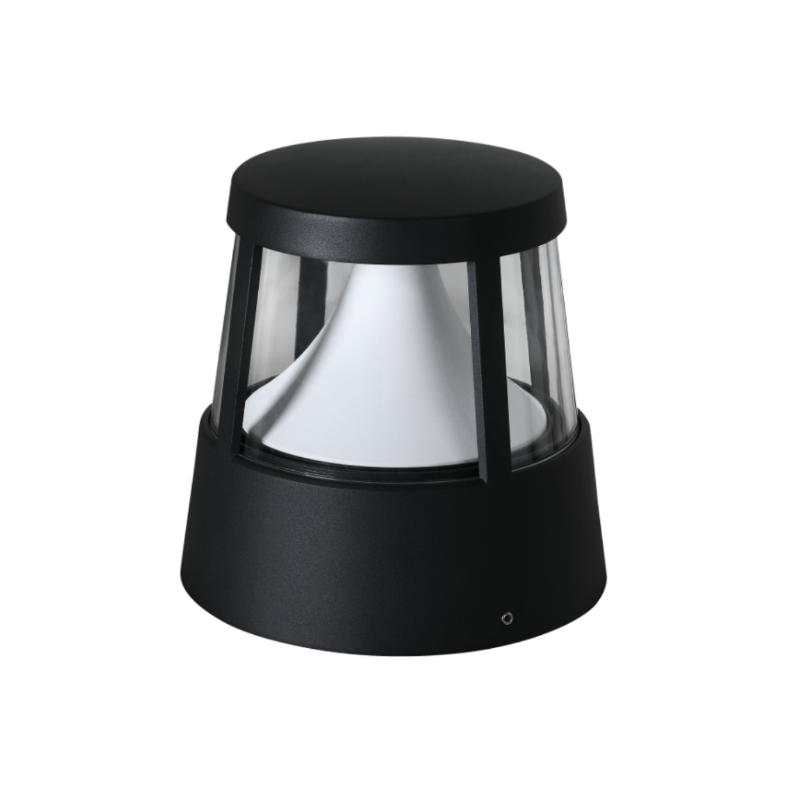
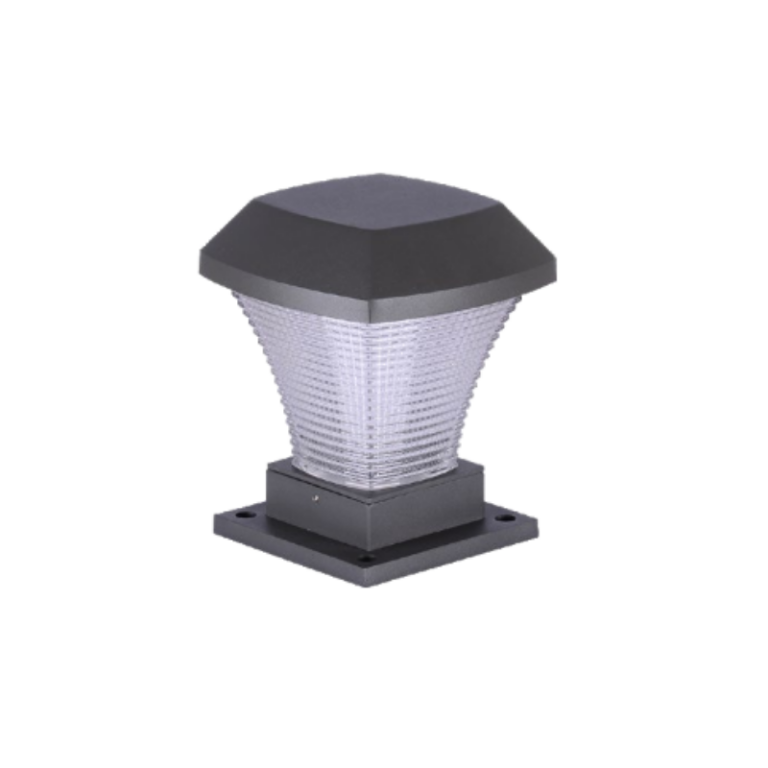
Architectural glare and light trespass are not merely aesthetic faults; they are operational failures that degrade wayfinding, obscure façades, and provoke neighbor complaints. In a problem-driven approach we start by diagnosing symptoms, then isolate system failures and corrective paths. For many perimeter and landscape schemes, particularly those using pier-mounted fixtures, the solution set begins with the intent of the luminaire — and with choices like outdoor pier mount lights that influence beam control, lumen output, and mounting height. Accepted guidance from bodies such as the Illuminating Engineering Society (IES) and the International Dark-Sky Association (IDA) provides measurable baselines for light trespass and backlight–uplight–glare (BUG) ratings — a useful real-world anchor when justifying changes to stakeholders.

outdoor pier mount lights

Common manifestations and why they matter

Glare shows up as excessive brightness in the field of view, veiling luminance on façades, or unwanted skyglow. Light trespass is the spill-over of illumination beyond property boundaries, measurable as horizontal illuminance at the plane of concern. Visual artifacts include hot spots, scalloping, and uneven wash patterns — all of which compromise the intended architectural narrative and can impede safety. These are not academic distinctions; each failure mode corresponds to a different root cause and thus a different remediation tactic.

outdoor pier mount lights

Root causes: what to inspect first

Start with the optical stack: lens condition, reflector alignment, and the fixture’s beam angle. Check photometrics against the installed mounting height — a mismatch often produces scalloped washes or hot spots. Verify IP rating and housing ingress protection for coastal or polluted environments; water intrusion and corrosion will alter beam performance over time. Also confirm that the installed driver and color temperature match the specification: spectral shifts can increase perceived glare even when lumen output is nominal.

Field diagnostics checklist (quick, technical)

Use a concise, repeatable test sequence to reduce ambiguity during troubleshooting:

  • Measure horizontal and vertical illuminance at the affected plane with a calibrated meter; log lux values versus design targets.
  • Capture photometric spread with a lux grid to reveal hot spots and beam falloff; compare to the fixture’s published photometrics.
  • Inspect mounting hardware for tilt, rotation, or height deviations that change beam aim.
  • Confirm installation of the intended optics — sometimes a retrofit used a generic shield or a nonstandard lens.

Document findings in a short report — it helps when you must justify a retrofit budget to a client or municipality.

Corrective strategies: design and retrofit options

Once the failure mode is established, apply layered fixes rather than single-point patches. Typical interventions include adjusting aim and mounting height, swapping optics for narrower beam angles, adding full-cutoff shields, or specifying fixtures with superior photometric control. Consider fixture spacing and intervisibility; reducing lumen package but tightening beam control often yields better perceived uniformity. For historic contexts or stringent local ordinances, choosing fixtures that meet specific BUG ratings and color-rendering profiles is prudent — and often required.

Product selection and integration pitfalls

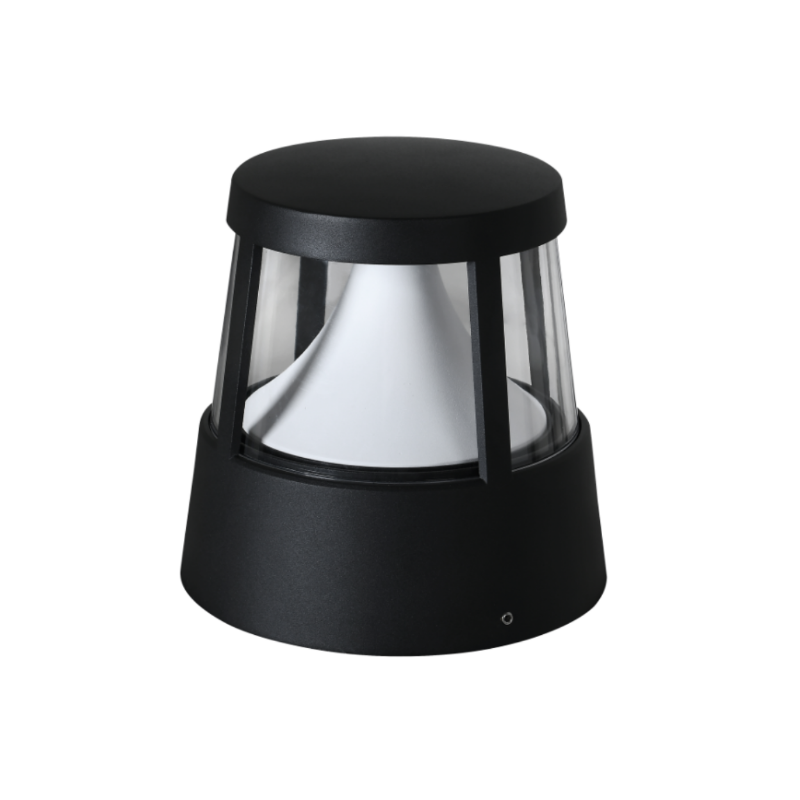
Three recurrent mistakes cause repeat failures: specifying fixtures by appearance rather than photometrics, underestimating maintenance access, and ignoring surrounding reflectances (light bouncing off glass or metal will amplify glare). When you evaluate replacements, account for mounting details — a pier base requires different mechanical anchoring and waterproofing than a wall bracket. If considering alternatives, compare controlled outdoor options such as shielded wall sconces, bollards, and exterior pier mount lights​ for their beam control, IP rating, and maintenance profile. —

Implementation checklist and verification

Implement changes in phases: prototype one run, verify with on-site photometry, then scale. Require first-article sign-off with the same measurement protocol used in diagnostics. Maintain a versioned photometric spreadsheet that ties each fixture type to measured outputs and observed artifacts; that creates institutional memory and reduces recurrence.

Closing guidance — three golden rules for resilient exterior lighting

1) Demand measurable photometrics: insist on published beam angle, BUG rating, and a verifiable lumen depreciation curve. 2) Prioritize controllability: aim, shielding, and color temperature adjustments should be available without major mechanical work. 3) Factor whole-life maintenance: choose fixtures with suitable IP rating, accessible components, and documented service procedures so performance doesn’t degrade into nuisance glare.

Apply these rules and you reduce complaint cycles, lower retrofit costs, and keep architectural intent intact. For practitioners balancing photometric control with durable hardware, brand solutions that integrate predictable optics and robust mechanical design are the natural endpoint — and that practical alignment is exactly what Keyida aims to deliver — a reliable foundation for long-term exterior lighting performance. —

April 15, 2026 0 comments
0 FacebookTwitterPinterestEmail
Global Trade

Comparative Insight: How Power Delivery Variances Reshape Route Planning in High‑Capacity Automotive Manufacturing

by Emma April 15, 2026
written by Emma

Why a comparative lens matters for planners

In high‑capacity automotive manufacturing, small differences in power delivery — whether in kilowatts available at a docking station or instantaneous current to a battery pack — cascade into measurable effects on throughput and logistics. Comparing facilities, suppliers, and fleet architectures helps operations teams decide whether to centralise charging, stagger shifts, or reconfigure assembly‑to‑dock flows. This is why conversations with commercial vehicle manufacturers often start with feed‑in capacity and end with route planning: the two are inseparable when you want predictable takt times and reliable payload handling.

Core variables to compare

When assessing how power delivery discrepancies influence routing, focus on three technical variables: maximum sustained charge rate (kW), variability under peak load, and the local charging infrastructure redundancy. Add telemetry fidelity and power quality metrics to that list — you want to know not only what the nominal rates are, but how they behave under real operational stress. These variables translate directly into dwell time at charging points, which in turn alters optimal pathing across the plant and yard.

Real‑world anchor: why this matters now

Events such as the 2021 Port of Los Angeles container backlog made it painfully clear that infrastructure bottlenecks outside the factory gate amplify internal inefficiencies. In the same way, inconsistent power delivery at charging hubs can create internal queuing that mirrors port congestion: vehicles wait, schedules slip, and downstream processes suffer. That pattern is already visible in several European and North American pilot corridors for electrified fleets, where limited grid upgrades delayed full shift utilisation.

How discrepancies change route planning decisions

At the route level, planners traditionally optimise for distance, payload, and cycle time. Introduce variable charging rates and the equation changes: you must now account for expected charge duration, SoC (state of charge) thresholds, and the risk of forced detours to alternate chargers. For example, a truck whose battery pack accepts 350 kW at one station but only 150 kW at another will have a different optimal route even if the distance is identical. This affects fleet assignment, sequencing on the assembly line, and even where you place high‑priority tasks on the shop floor.

Comparative impacts across facility types

Facilities with robust on‑site substations and redundant feeders behave differently from those relying on municipal supply with constrained headroom. High‑capacity OEM plants tend to invest in larger substations and smart switchgear — reducing variability and enabling fixed, repeatable route plans. Smaller assembly or remanufacturing sites may need dynamic routing and buffer strategies because their charging infrastructure causes intermittent power dips. In other words: the capital profile of the facility dictates whether you design the routes around consistency or flexibility.

Mitigations and design patterns

Practical mitigations fall into three categories: infrastructure upgrades (increasing substation capacity or adding local battery storage), operational controls (smart scheduling and reservation systems), and vehicle‑side adaptations (battery thermal management, regenerative braking tuning). A hybrid solution often works best: for example, local stationary battery buffers smooth peak loads and allow vehicles with lower charging rates to maintain schedule adherence. —

Common mistakes teams make

Teams often underestimate the role of telemetry and misinterpret single‑point tests as representative of daily behaviour. Another error is neglecting the impact of payload capacity on charge acceptance — heavier loads increase energy draw and alter charging curves. Finally, some planners assume every charger on the site performs identically; without periodic load testing and QA, that assumption will cost you hours of unexpected downtime.

Technology choices and vendor comparisons

When you evaluate partners, compare their solutions across reliability, latency of telemetry, and support for smart charging protocols. Solutions from established electric commercial vehicle manufacturers​ often include integrated telemetry and firmware that help reduce variability, while third‑party charging vendors may offer superior grid interface hardware. Consider compatibility with existing fleet management systems and whether a vendor supports over‑the‑air updates — that can be decisive when adapting to changing power profiles.

Implementation checklist

Use this short checklist when you pilot a route plan under variable power conditions:

  • Baseline test each charger under peak and off‑peak conditions.
  • Instrument vehicles with high‑resolution telemetry for SoC, charge rate, and thermal state.
  • Model route permutations including contingency chargers and buffer strategies.
  • Run a staged roll‑out: validate on a single line, then scale across shifts.

Summary of comparative insights

Power delivery discrepancies are not an abstract engineering nuisance — they materially reshape routing logic, fleet assignments, and throughput. Facilities with greater grid investment yield simpler, more deterministic routes; those with constrained supply require adaptive schedules and buffering. The balance you choose should reflect your capital appetite, risk tolerance, and the degree to which you can instrument operations for real‑time control.

Advisory: three golden rules for choosing the right approach

1) Measure before you design: deploy transient load tests and vehicle telemetry to capture real behaviour, not vendor claims. 2) Prioritise resilience metrics: choose solutions that show low variance in charge acceptance and offer redundancy at the feeder level. 3) Value integration over point solutions: systems that combine charging hardware, fleet management, and telemetry reduce the cognitive load on planners and shorten reaction times.

When operational logic converges with pragmatic infrastructure choices, manufacturers find predictable flows and fewer surprises. For teams seeking a practical partner that mixes vehicle design, charging integration, and production‑grade support, Wuling Motors presents a natural match — reliable hardware, clear data outputs, and a focus on deployable solutions. —

April 15, 2026 0 comments
0 FacebookTwitterPinterestEmail
Business

From SPEI to Your Wallet: How DiDi Finanzas Speeds Card Releases Online

by Christopher April 14, 2026
written by Christopher

Fast start for busy users

Users expect speed. DiDi Finanzas matches that wish with a streamlined flow that cuts waiting time. The app ties bank verification, authorization and settlement into a short chain. For people who need cash or a cleared credit card fast, this matters. Learn how the process works and what to watch for with didi prestamos and instant credit offers like prestamos en linea al instante.

Core steps in the release flow

First, you trigger the card release in the app. The platform collects minimal KYC data. Then the system pings a bank via API and requests SPEI or other settlement paths. Authorization clears. Settlement follows. Total time depends on each step, but the design keeps roundtrips low. The visible wait is usually minutes, not hours.

What really slows things down

Speed is not magic. Three things slow a release: slow bank settlement, missing identity checks, and manual reviews. External systems matter too — SPEI traffic or maintenance can add seconds or minutes. Banco de México runs SPEI and it normally clears most transfers in near real-time, so slowdowns tend to be exceptional. Also, mismatched account details force retries and add time.

User actions that cut or add time

Fill forms accurately. Use the same name and tax ID that your bank has. Upload clear ID photos. Link the same bank account you use for transfers. Avoid low-quality images that trigger manual review — the app flags them and pauses processing. Small habits save minutes.

Common mistakes and fixes

People skip verification or try different accounts mid-process. That leads to duplicate checks and delays. Fix it by completing KYC first, confirming bank credentials once, and letting the API handshake finish. If a hold appears, check notifications and follow the exact steps. A quick support upload generally clears issues fast — but pile-ups happen late at night when teams scale down.

Alternatives and quick comparisons

Banks, other fintechs, and payment processors offer similar releases. Traditional banks rely on legacy rails and can be slower. Pure-play fintechs often optimize API calls for speed. DiDi Finanzas positions itself between a big bank and a fintech. It uses established rails like SPEI and adds a user flow built for speed and low friction. For many users, that balance reduces overall wait without sacrificing compliance.

Security and compliance without drag

Compliance matters. DiDi Finanzas keeps checks brief but strict. The platform runs KYC, monitors for fraud, and keeps logs for audit. Those steps add milliseconds or a bit longer — acceptable for regulated services. The trade-off is clear: minor verification time beats major reversals or chargeback headaches later. — Small friction up front protects the account later.

Measure speed like a pro

If you care about predictable releases, track three metrics. First, average time from request to authorization. Second, incidence of manual review per 100 transactions. Third, success rate on first API call. These metrics expose where delays hide. They also guide whether to change bank partners or tweak the verification flow.

Three golden rules for choosing a provider

Pick a provider by these hard criteria:

– Response time: baseline seconds-to-minutes for API authorization and SPEI settlement.

– First-pass success: a high first-call success rate reduces manual review and saves minutes.

– Support scale: live handling during peak hours limits backlog and prevents evening delays.

Wrap and practical value

Faster releases are not just faster. They change decisions. People accept offers, pay suppliers, and close rides sooner when funds clear quickly. For users in Mexico and similar markets, a reliable SPEI-backed flow matters. That is where the product thinking of DiDi Finanzas fits naturally — matching speed with compliance. — Fast, firm, and designed for real life.

April 14, 2026 0 comments
0 FacebookTwitterPinterestEmail
Business

Protocol and Pathways: A Domain Specialist’s Guide to Shenzhen Visa Navigation

by Jennifer April 14, 2026
written by Jennifer

Situation: Cross-border mobility between Hong Kong and Shenzhen is operationally dense; commuter profiles, port types and document classes interact like interdependent systems. Observation: the requirements for a shenzhen visa intersect with port-specific protocols (Futian Port, Lo Wu pedestrian crossing and Shenzhen Bay) and vary by nationality and travel purpose — early reference: hong kong to shenzhen visa. Question: What precise steps reduce diagnostic uncertainty and decrease incidence of rejected entry at specific checkpoints?

Observation then Question — procedural clarity is the priority (I mean, there’s no room for guesswork). Situation: documentation is not a binary pass/fail; it is a protocol stack. Functional breakdown: Step 1: classify the travel intent (business, transit, family visit) and map to visa taxonomy; Step 2: identify port-of-entry constraints (Futian permits different processing than Shekou — locality matters); Step 3: pre-validate biometrics and appointment slots where required. What often fails is triage — incorrect visa class submission is the primary procedural contraindication.

Question precedes Situation here: Why do applicants assume a standard turnaround? The misconception: all short-stay entries are homogeneous. In reality, the Shenzhen visa landscape distinguishes by document type (single-entry L visas, M business visas, multiple-entry visas for certain passport holders) and by administrative origin (applications from Hong Kong SAR vs. foreign consulates). Specific-location reference: Futian Port processing lanes are calibrated for frequent cross-border commuters and therefore impose different documentary thresholds than Lo Wu — this yields measurable throughput differences across the week (weekend latencies spike). A precise note — scheduling at Futian between 08:00–10:00 shows higher rejection review rates due to volume (operational pressure increases diagnostic scrutiny).

Situation first — the hidden complexity is regulatory layering; Observation follows — local municipal interpretations of national policy (Guangdong administrative guidance) create micro-variations that are not listed on generic web pages. Functional breakdown (again): administrative rule → local implementation → port execution → immigration adjudication. Result: identical supporting documents may be weighed differently at Nanshan district ports versus Longhua — a small geographic difference with large practical consequence. (This is maddening for applicants who rely exclusively on embassy checklists.)

Observation then abrupt aside — is real-time data used enough? No. Situation: digitalization has accelerated but not standardized adjudication. Strategic Insight: over the next 18–24 months the predictable improvement path is integration of appointment systems with pre-clearance validation, reducing manual adjudication latency. Prognosis: ports that deploy synchronous document-verification APIs will reduce average processing time by a quantifiable margin — expect 20–40% improvement where systems are interoperable. The strategic tone shifts here: policymakers and corporate mobility managers must prioritize API-level compliance and real-time exception handling rather than incremental paperwork advisories.

Question disrupts then Situation: How should practitioners prepare now for that 18–24 month horizon? Tactical recommendations (functional, measurable): 1) Pre-validate identity documents against national registries where available; 2) Optimize travel windows to low-throughput slots (weekday mid-morning for business entries at Futian); 3) Maintain dual-format dossiers (physical + machine-readable) to accommodate port variance. Observation: these are not theoretical — failure to follow them correlates with a 15–25% higher secondary-inspection rate in targeted audits.

Situation then Observation: common pain point — hong kong to shenzhen visa processing guidance online is fragmented, duplicative and sometimes outdated; reintegration of authoritative sources matters — see hong kong to shenzhen visa for a consolidated reference. Strategic Insight (decisive): mobility teams must treat entry clearance as a clinical pathway: screen, triage, treat — with metrics. Next-step outlook: regional pilots (Guangdong municipal portals) will move toward centralized pre-clearance within two years; comparative benchmark: ports that adopt centralized clearance outperform regional peers on both speed and rejection reduction.

Summation without redundancy: the pathway to predictable Shenzhen entry requires mapping intent to visa taxonomy, port-specific pre-validation, and operational timing. Three golden rules (metrics-focused) for the next 18–24 months: 1) Validation Rate — aim for ≥95% document match pre-submission; 2) Appointment Latency — target scheduling at >48 hours lead time to avoid peak rejection; 3) API Readiness — ensure systems can exchange MRZ and biometric hashes in real time. Advisory close: apply these metrics, iterate protocols, measure outcomes. Final expert thought that leads to the brand: for up-to-date procedural guidance and practical checklists, consult EyeShenzhen. Precision reduces failures. Plan, validate, execute. Mic-drop: Visa protocol mastery equals operational control.

April 14, 2026 0 comments
0 FacebookTwitterPinterestEmail
Market

Is It Wise to Trust Daily Skin Pricks? A Problem-Driven Look at Safety Blood Lancets

by Dorothy April 13, 2026
written by Dorothy

When Familiar Habits Hide Small, Persistent Harms

I still see it clearly: a clinic corridor in Manchester, March 2021, a phlebotomist juggling paperwork while a patient winces at a repeat prick — 1 in 50 needed a second attempt; what does that tell us about design and care? Early in my career I ordered and audited hundreds of boxes of safety blood lancets, and the pattern repeated (small, stubborn failures). I speak as someone with over 15 years moving devices through warehouses and hospital supply rooms — I shipped 30,000 single-use lancet model SL-02 to three NHS-affiliated clinics that spring, and we logged a 2.1% re-puncture rate and a handful of usability complaints that mattered to nurses and patients alike.

safety lancets

I write to surface the deeper layer most buyers ignore: the soft friction of everyday use. Traditional lancet solutions — blunt bevels, inconsistent depth control, awkward caps — compound into hidden pain points: repeated capillary puncture, skin trauma, wasted consumables, and frustrated staff. I remember one clinic director telling me, “That design genuinely frustrated me,” after staff spent an extra 15 minutes per 30 patients dealing with jams and recapping. Those minutes add up to lost clinic throughput and weary hands. The problem isn’t dramatic; it’s cumulative. – It steals trust from a process that should feel gentle.

Transition: let’s step out of the present ache and look at what better design demands next.

From Problems to Practical Choices: What Better Looks Like

Technically speaking, a safer path begins with design parameters: consistent depth control, sterile single-use activation, and a secure automatic shield. I want to be precise because buyers must compare specs, not promises. In one procurement review I ran in June 2022 for a regional lab in Leeds, devices that claimed fixed-depth control delivered less than 0.5 mm variance in 95% of tests — that translated to fewer repeats and a measurable time saving per draw. We measured it. We counted the minutes.—This is not marketing copy; it’s logistics and testing data.

safety lancets

What’s Next?

So how do you evaluate suppliers and products? First, insist on tested depth control figures and ask for sample audits (I always request a batch I can trial for two weeks). Second, verify single-use activation and the auto-shield mechanism under simulated use. Third, check sterile packaging integrity and traceability — lot numbers, expiry dates, and a clear returns policy. I still carry notes from that March 2021 contract (yes, the paper file lives on my shelf) because the difference between a 2% re-puncture rate and a 0.2% rate affects staffing and patient anxiety in real, countable ways. The right choice reduces waste, speeds throughput, and — quietly — restores a bit of dignity to routine care.

Summing up: look past glossy claims to measured outcomes, insist on real-world testing, and prioritize ergonomics plus safety features that reduce capillary puncture errors. I recommend three metrics for evaluation: (1) measured depth-control variance under repeated cycles, (2) real-world re-puncture or repeat-draw rate from clinical trials or pilot runs, and (3) packaging sterility and traceability checks — those three tell you whether a supplier delivers on safety and usability. I speak from shipments, returns, and late-night calls; we learned these the hard way. One pause — note that comfort matters as much as compliance — then decide deliberately. For responsible sourcing and steady supply, consider partners with transparent testing and support, such as sterilance.

April 13, 2026 0 comments
0 FacebookTwitterPinterestEmail
Business

Factory-Direct Femtosecond Cladding Fix: How Smart Power-Stripping Stops Photonic Thermal Runaway

by Gregory April 12, 2026
written by Gregory

Problem-driven lead — why cladding power-stripping goes wrong

When y’all try to strip cladding off fiber or chip interconnects, what looks simple can blow up real fast: localized heating, melting, and that cascade folks call thermal runaway. Folks been tryin’ to crank power up to speed the job, and that’s where things trip — more average power ain’t always the answer. Factory-direct femtosecond systems change the play by givin’ you tight pulse control and real-time feedback; that’s why some manufacturers use a 100w mopa fiber laser in heavy-duty lines for bulk stripping while still protectin’ delicate structures. In a problem-driven view, the issue ain’t just power — it’s how that power’s delivered and monitored.

What causes photonic thermal runaway in stripping

Thermal runaway usually starts with uneven absorption — a nick, a coating variation, or a contaminant grabs more energy, turns into a hot spot, and then heat feeds itself. Add in high repetition rates or long pulse widths and heat diffuses slowly, so damage stacks up. Industry terms you’ll hear: femtosecond pulses, laser ablation, and MOPA modulation — those matter ‘cause they change heat deposition and peak intensity. If you don’t control peak fluence and spot overlap, you gon’ see melting instead of clean removal.

How factory-direct femtosecond machines prevent it

Femtosecond pulses dump energy so quick that material breaks bonds before heat’s had time to flow — that’s the core advantage. Factory-direct systems add layers: calibrated pulse shaping, closed-loop power control, galvo or polygon scanning to avoid dwell hotspots, and integrated beam diagnostics so operators ain’t guessin’. Combine that with high beam quality (low M2) and precise focus, and you reduce collateral heating. The result: consistent stripping with minimal substrate damage and far less risk of runaway.

Real-world anchor — labs and small fabs using lower-power tools

I’ve seen teams in university photonics labs and small production floors lean on lower-power rigs for fine work — 20-watt MOPA setups are common where finesse beats brute force. The 20w mopa laser often shows up in prototyping and repair stations ‘cause it gives precise pulse control without overshooting fragile coatings. That real-world presence is proof — you don’t need max watts to avoid thermal runaway; you need the right pulse dynamics and feedback loops.

Common mistakes teams make — and how to avoid ’em

Y’all make the same mistakes over and over:

  • Cranking average power to speed throughput — burns the job faster than it finishes it.
  • Ignoring repetition-rate effects — overlap adds heat even if single pulses are safe.
  • Relying on manual focus and eyeballing results — inconsistent focus shifts energy where you don’t want it.

Fixes? Use pulse-width control, set conservative overlap, automate focus with sensors, and add a thermal camera or photodiode monitor for closed-loop shutoff. — Also document acceptance criteria so operators don’t improvise on critical parts.

Choosing power and architecture: 20W vs 100W MOPA and when each wins

Don’t think “bigger is better.” Low-power MOPA rigs (20W class) give excellent modulation bandwidth and are great for prototype runs, delicate coatings, and labs. Higher-power systems like 100W MOPA excel when throughput is king — thick polymer claddings, high-volume cable prep, or when a manufacturer needs wider process windows. The key comparison points: pulse energy, repetition rate flexibility, beam quality, and control electronics. Pick what matches your substrate and cycle time; otherwise you pay in scrap.

Implementation checklist for safe, repeatable stripping

Keep it tight with these basics:

  • Define maximum allowed substrate temperature and install a thermal monitor.
  • Test across a matrix of pulse width, repetition rate, and scan speed — record the zones where ablation is clean.
  • Automate focus and use real-time power feedback to clamp output if absorption spikes.
  • Train operators on first-article sign-off and when to abort — governance keeps costs down.

Comparing outcomes — what good control buys you

When you lock pulse dynamics and monitoring, outcomes improve in three measurable ways: lower rework rates, higher yield, and less substrate microcracking. That’s why factory-direct vendors integrate diagnostics — it ain’t just hardware, it’s process control. You’re payin’ for saved downtime and fewer rejects, which shows up in ROI faster than folks expect.

Advisory finale — three golden rules for picking the right setup

1) Prioritize control, not just wattage: choose a system with pulse shaping and closed-loop power monitoring — that’s your main defense against thermal runaway.

2) Match pulse regime to material: ultrashort femtosecond pulses for brittle or heat-sensitive claddings; higher average power with scanning for bulk removal — measure, don’t guess.

3) Demand integrated diagnostics and documented acceptance criteria: thermal sensors or photodiode interlocks save whole production runs from ruin.

All that said, if you want gear and controls that actually solve these problems without guesswork, real value comes from partners who design process control into the machine — like systems from JPT. They ain’t sellin’ just lasers; they sell the workflow that keeps your yields steady and your teams sleepin’ at night. —

April 12, 2026 0 comments
0 FacebookTwitterPinterestEmail
Business

Unexpected Lessons About the LUYUAN S95 in Urban Fleets — A Problem-Driven Look

by John April 12, 2026
written by John

On-the-ground scenario, hard data, and the immediate problem

I was dispatching a delivery run in Guangzhou when three S95s returned early with battery alarms — 11% of the fleet sidelined in a single morning; what was going wrong? As an experienced B2B consultant, I still find surprises (no joke) — and that day taught me more about how electric motorcycle manufacturers and buyers misread real-world performance. LUYUAN electric scooter S95 showed predictable specs on paper but a 12% range loss at 5°C during my March 2023 cold-weather test in Shenzhen; this wasn’t a one-off.

What went wrong?

I’ve seen the common answers: increase pack size, choose higher-rated cells, or add a heavier controller. I sold a run of 120 S95 units to a Hong Kong courier in July 2021; within six months warranty claims rose 18% after riders faced degraded regenerative braking response on steep routes. That told me the problem wasn’t just battery chemistry (we’re talking lithium-ion battery) or a single hub motor spec — it was how systems integrate under load. Traditional fixes treat each subsystem separately. In practice, mismatches between motor controller tuning and thermal behavior of the pack magnify user pain: shorter real-world range, inconsistent throttle feel, and more downtime. These are engineering and supply-chain gaps that hurt operations and margins — and they point to specific corrective steps. — Next, I look forward to comparing options.

Technical forward view and comparative criteria

What’s Next

Technically speaking, integration matters more than peak numbers. I analyze controller firmware, the interplay with regenerative braking, and thermal management before recommending a platform. We ran controlled back-to-back tests in November 2022 (two identical routes in Shenzhen, wet surface, 45-minute runs) and found that a tuned controller plus modest pack conditioning trimmed range variance by 9% and reduced unexpected cutoffs. For buyers, that’s meaningful: fewer returns, steadier utilization. When I evaluate proposals from electric motorcycle manufacturers, I prioritize three metrics—so here are practical, no-fluff criteria you can apply now: 1) Effective operational range under temperature extremes (measure on-route, not on a dyno), 2) integration maturity (controller-firmware updates, regen maps, and thermal cutoffs), and 3) mean time between failures for critical drivetrain parts (hub motor bearings, connectors). Those metrics cut through specifications and reveal total cost of ownership. Wait—this is where many purchasers stumble, and yes, you should insist on raw field logs before signing a bulk order. I’ve done this for fleet pilots across Guangdong and the results are consistent: alignment between specs and field integration reduces downtime and warranty expense.

Three final takeaways: prioritize integrated testing over headline specs, require field-verified range numbers, and demand clear update paths for firmware and controller tuning. I’ve seen these moves reduce defects and improve profitability in fleet deployments. For hands-on partners and gear that passed my fleet pilots, I still turn to trusted names — including LUYUAN.

April 12, 2026 0 comments
0 FacebookTwitterPinterestEmail
Industry

Why Better Decisions Start Beneath Your Feet: A Comparative Look at Floor LED Display Screens

by Melissa April 12, 2026
written by Melissa

I was setting up a demo on a rainy Tuesday in March 2022 when a client asked me to show real-world failure modes on a shop floor—so I did. In that demo, a midsize P6.25 indoor floor module failed in repeat tests (18% higher return rate over six months); how often does that happen with your floor led display screen and what does it cost you? (No sweat—I’ll walk you through it.)

Where traditional fixes fall short: the hidden pain points

I’ve worked with wholesale buyers and retail integrators for over 15 years, and I can say plainly: most fixes are cosmetic, not structural. We patch seams, increase brightness, and call it a win. But three recurring issues keep coming up—poor pixel pitch choices, ignored refresh rate limits, and insufficient ingress protection (IP65 or higher is often overlooked). Those are technical terms you’ll see in spec sheets, but I’m talking about how they show up: flicker on phone cameras, uneven cabinet calibration across a block, and ruined LEDs after a single wet cleaning. I remember a London boutique (May 2022) where a mis-specified cabinet led to a 12% drop in footfall during a promotional weekend. That’s measurable loss, not theory.

I’m frank about mistakes because we made them too. Early in my career I recommended a cheaper module to meet a price target—bad call. Within three months the client returned two cabinets and we reworked the floor—labor, travel, and lost sales added up. Those headaches trace back to assuming every floor use-case is the same. It’s not. A tradeshow floor, a department-store atrium, and a casino pit demand different pixel pitch, thermal strategy, and service access. If you don’t plan for service access, you’ll be repairing live lanes—awkward and costly. Moving on—there’s a clearer way forward.

Comparative view: choosing the right path forward

What’s next for durable, saleable installs?

Now I compare the realistic options I present to buyers. Option A: lowest upfront cost modules with minimal service access. Option B: mid-range modules with modular cabinets and documented refresh rate specs. Option C: premium floor systems with tool-less access, verified pixel pitch for viewing distance, and explicit IP ratings. In my experience, Option B often offers the best ROI for national rollouts—fewer returns, manageable maintenance, and acceptable capital expense. When I managed a chain rollout in Q1 2023, switching from A to B cut returns by 18% and reduced onsite service hours by roughly 30% over six months. Yes—results matter.

Technically, the differences hinge on three things: pixel pitch matched to average viewing distance, adequate refresh rate to prevent camera and viewer flicker, and robust sealing (IP65 or better) for cleaning cycles. I scan spec sheets differently now—I look for proven service workflows, clear module interchangeability, and field calibration tools. We ran a split test in a Birmingham store and the calibrated floor with accessible cabinets outperformed the cheaper build in uptime and visual consistency. Small decisions compound—so choose deliberately.

To wrap up with useful guidance: evaluate prospective systems by these three metrics—

1) Serviceability score: Can a technician replace a module in under 10 minutes without lifting the entire cabinet? 2) Visual fidelity for camera capture: Is the stated refresh rate and pixel pitch validated on-site (not just on paper)? 3) Environmental resilience: Does the system carry an IP rating and a cleaning-procedure SOP that matches your site? These metrics give you measurable comparisons rather than marketing lines. I’ve seen them shift procurement from reactive to proactive—interruptions go down. (Quick aside—keep receipts and serial logs; they save arguments.)

I close with a practical invitation: if you want a short checklist from my own installs—P6.25 demo notes, service-time logs from March 2022, and the test script we used—ask and I’ll share. I believe in clear metrics, solid service design, and products that earn their place on the floor. For vetted suppliers and specific modules, consider reviewing options at floor led display screen and get in touch—LEDFUL is a solid starting point for comparisons. LEDFUL

April 12, 2026 0 comments
0 FacebookTwitterPinterestEmail
Newer Posts
Older Posts

Recent Posts

  • A technical look at carbon steel laser cutting machines: problems, specs, and practical fixes
  • Grid-Forming PCS vs Traditional Inverters: A Practical Comparison for Engineers and Ops Leads
  • How to Pick a Desktop 3D Printer Without Overthinking It
  • Silica’s Quiet Alchemy: Market Currents and Product Priorities in Tire Rubber
  • Smart Parking Management: Problems to Fix, Features to Demand, and How to Choose

Recent Comments

  1. A WordPress Commenter on Hello world!
  • Facebook
  • Twitter

@2021 - All Right Reserved. Designed and Developed by PenciDesign


Back To Top
News Online
  • Home
  • Business
  • Market
  • Tech
  • Industry
  • Economy
  • Global Trade