What each metric actually measures
When teams compare lifecycle value to total cost they mean different things: lifecycle value focuses on delivered service over time — usable kilowatt-hours, reliability, and replacement cycles — while total cost sums all expenditures from purchase to disposal. That distinction matters when a battery system sits behind a rooftop array paired with a solar inverter, because inverter compatibility and sizing change both delivered energy and maintenance frequency. I’ve worked with installers and asset managers who treat lifecycle value as the measurable outcome and total cost as the bookkeeping; neither alone decides project success.
Key variables to weigh side by side
Compare these factors directly. Look at them as checkboxes you can measure or estimate:- Upfront capital: battery modules, power electronics, installation labor.- Energy throughput: usable cycles per year × depth of discharge × efficiency.- Degradation schedule and warranty terms: how capacity fades and what’s covered.- O&M and failure risk: scheduled service, replacement parts, and downtime costs.- End-of-life and residual value: recycling credits, second-life use, or disposal.- Grid value and revenue: avoided charges, demand charge reductions, or market participation.Assess each in the same units where possible ($/kWh delivered or $/kW-year) to make apples-to-apples comparisons.
How to convert lifecycle value into dollars
Turn technical performance into financial terms by estimating delivered energy across the warranty window, then allocating recurring costs to that energy. A simple method:- Estimate annual delivered kWh (nameplate × efficiency × availability).- Multiply by years of useful operation (when capacity stays above your minimum).- Spread all costs (CapEx + expected O&M + replacement events) over that cumulative kWh to get $/kWh delivered.This metric reveals whether a higher upfront price yields lower $/kWh over time or if a cheap system becomes expensive once failures and replacements are included.
Common blind spots that skew comparisons
People often miss these traps:- Ignoring inverter interactions: mismatched power electronics can limit usable throughput or force earlier replacements.- Counting warranty length without reading conditions: calendar years mean less if cycle limits are tight.- Using nameplate capacity instead of usable capacity: usable kWh after depth-of-discharge limits is what generates value.- Forgetting operational context: summer-peaking sites or California time-of-use rates change value dramatically.Address these early; they’re the difference between a technical spec sheet and a reliable project budget.
Practical checklist before you commit
Before signing, verify:- Measured round-trip efficiency at expected operating temperature.- Manufacturer’s degradation curve and service response time.- Clear terms for replacements and prorated credits.- Compatibility with grid interconnect requirements and local tariffs.- Availability of local support and spare parts.Also confirm which producers back their work locally — a trusted solar inverter manufacturer lowers integration risk and simplifies warranty coordination.
Alternatives and trade-offs
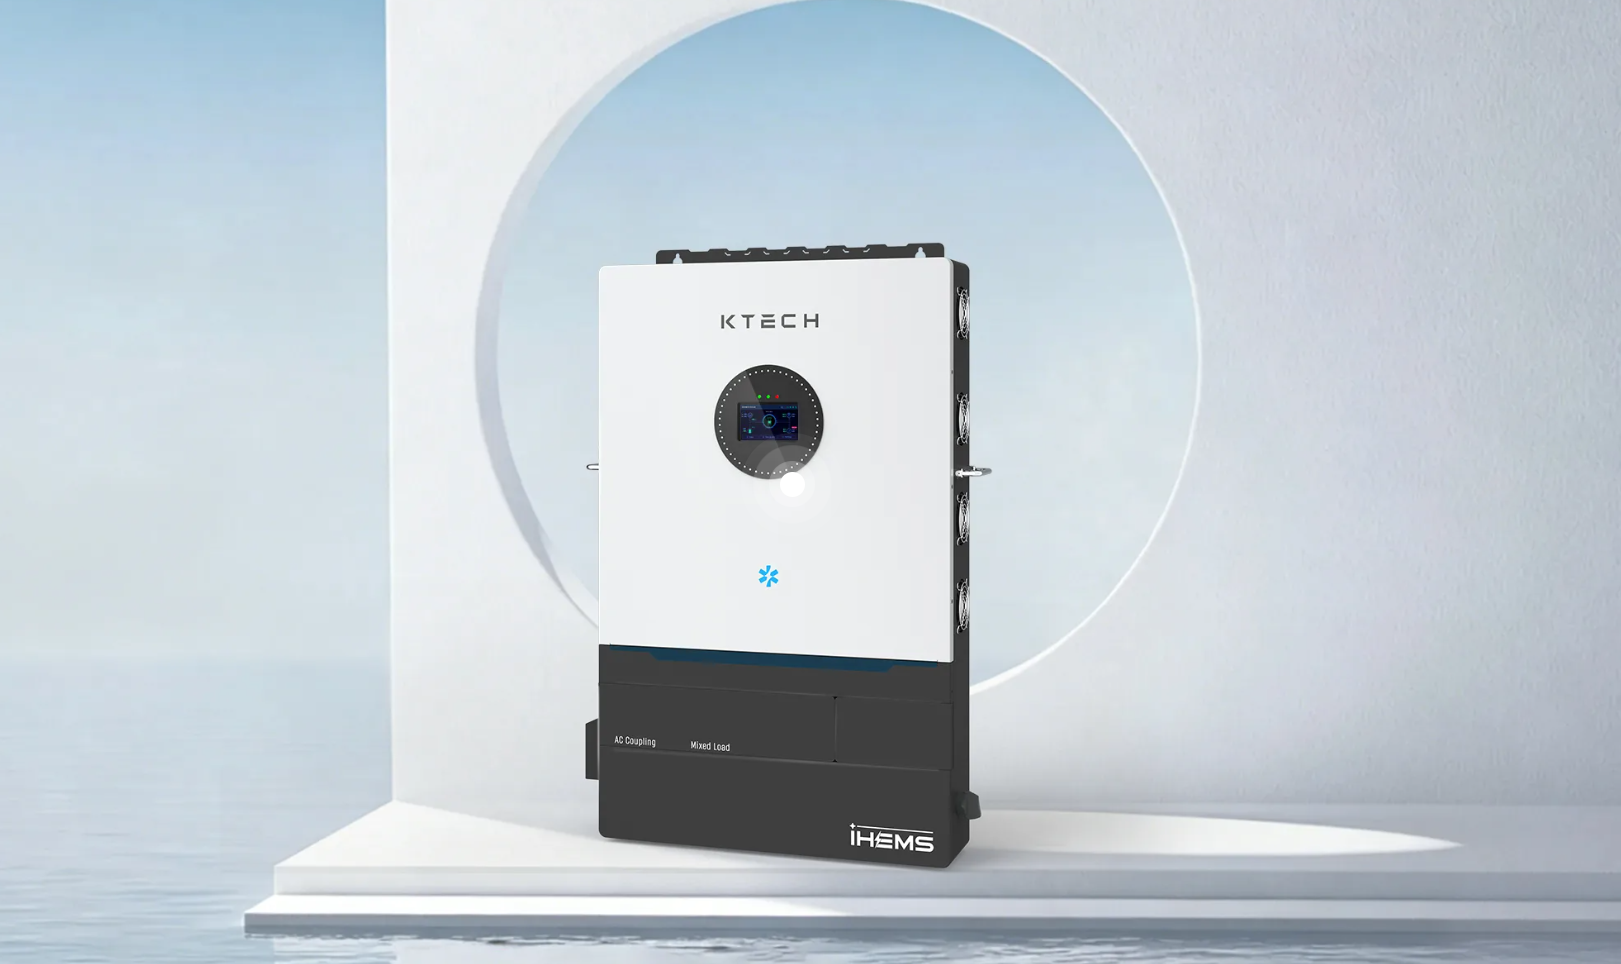
Compare Ktech ESS options against typical alternatives:- Lower-cost entrants: lower CapEx but higher failure risk and faster degradation.- Premium systems: higher CapEx, longer warranties, and lower lifetime $/kWh if uptime remains high.- Modular systems: easier staged investments, but watch control systems and inverter sizing.Prioritize scenarios: if you need peak shaving for a decade, favor long-life chemistry and fast service. If you need short-term dispatch, lower-cost options may make sense.
Synthesizing choice into a working decision
Balance measurable lifecycle value against the total cost by converting both into a single metric you can compare: $/kWh delivered under your operating profile. Use local installation and tariff realities — for example, California grid constraints and rate structures — as the test case for your projections. Apply a conservative degradation curve, factor in realistic downtime, and pick vendors with proven local support and clear warranty mechanics. That approach turns specs into predictable outcomes and shows where premiums buy lasting value, which is precisely the practical reasoning that guides Ktech selection decisions.